
Analyzing data across reviews
If it takes a lot of time and effort to analyze the data you have collected, it will not lead to improvement.
However, the process of outputting the data to Excel every time is tedious.
Lightning Review can flexibly aggregate and graph the indications of several reviews with a dedicated pivot analyzing tool.
It is possible to analyze the issues pointed out from all perspectives, including the person in charge and the process.
-
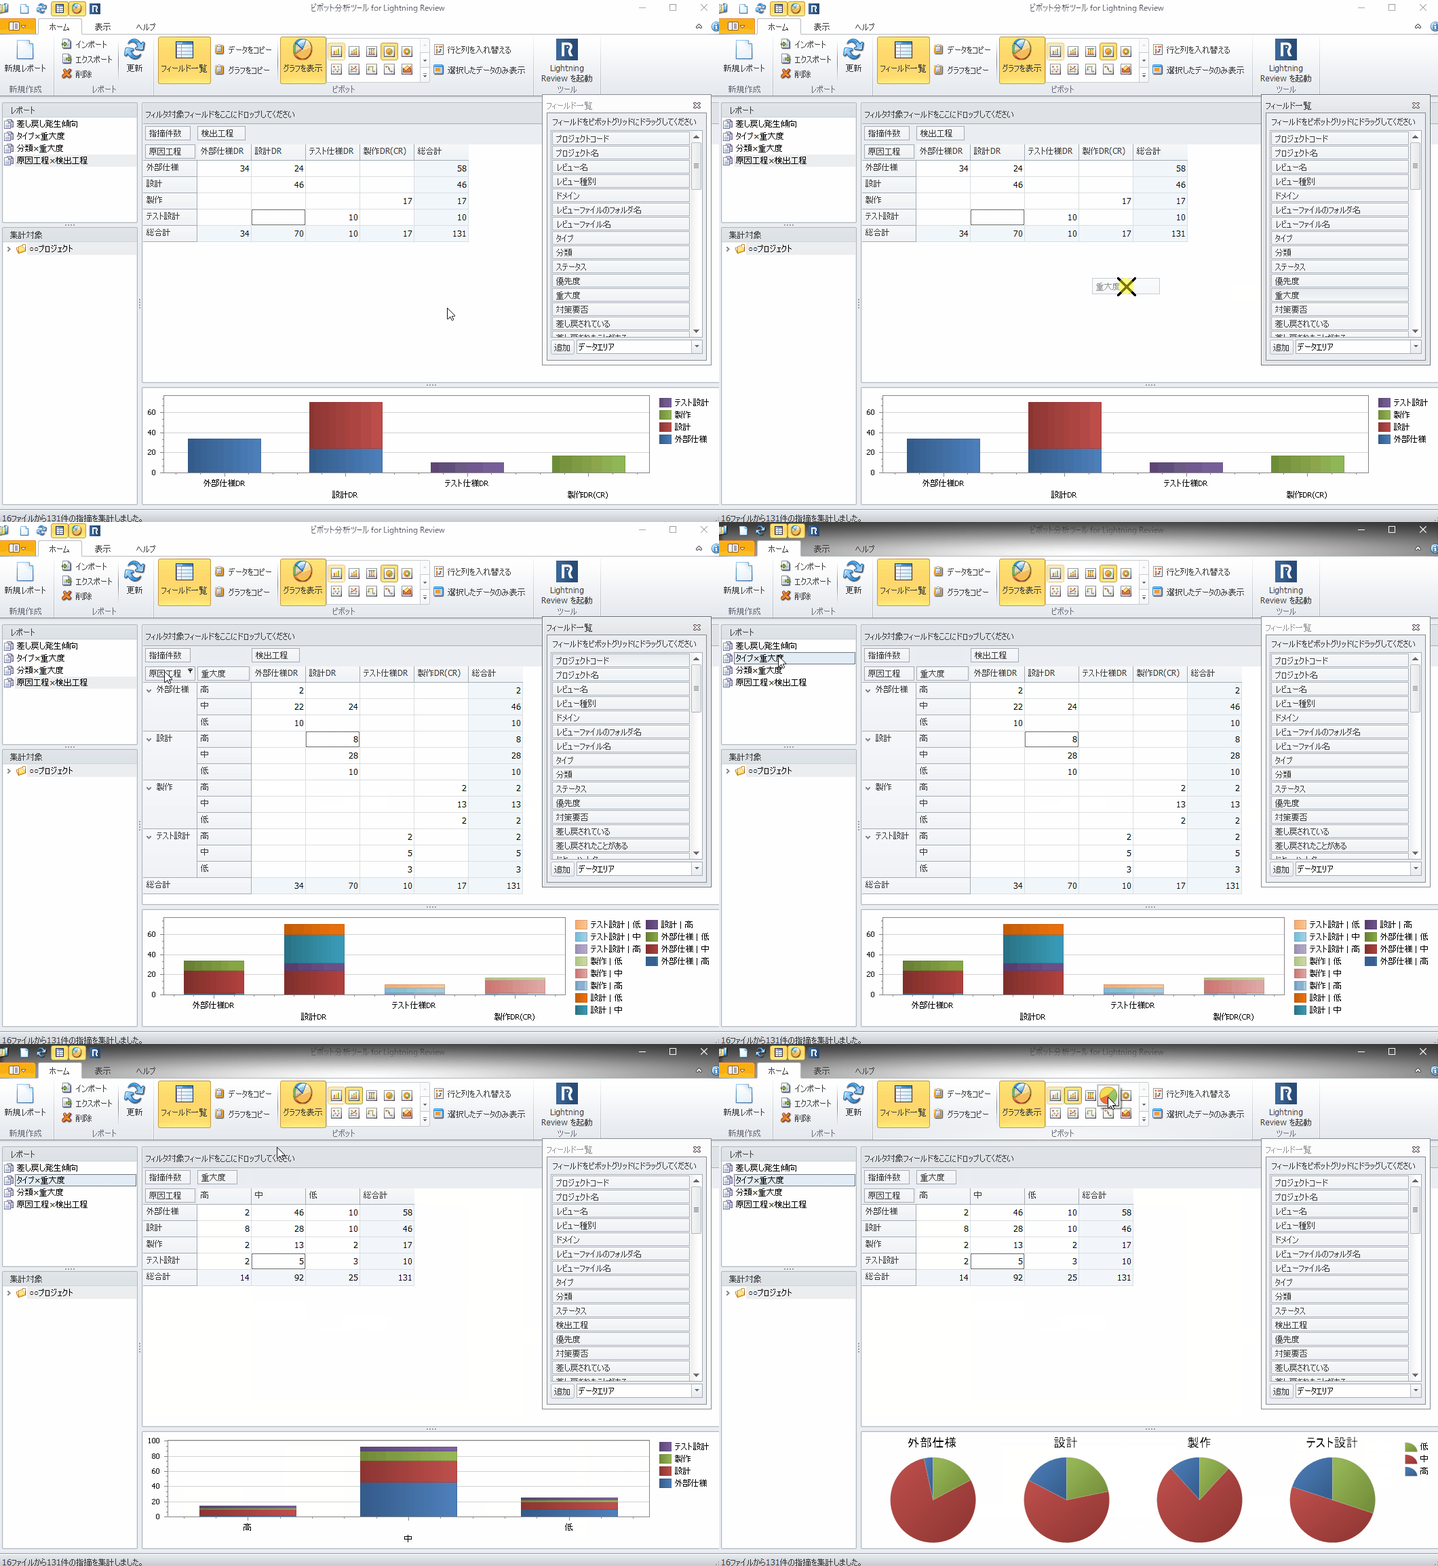
Flexible aggregation of data by drag & drop
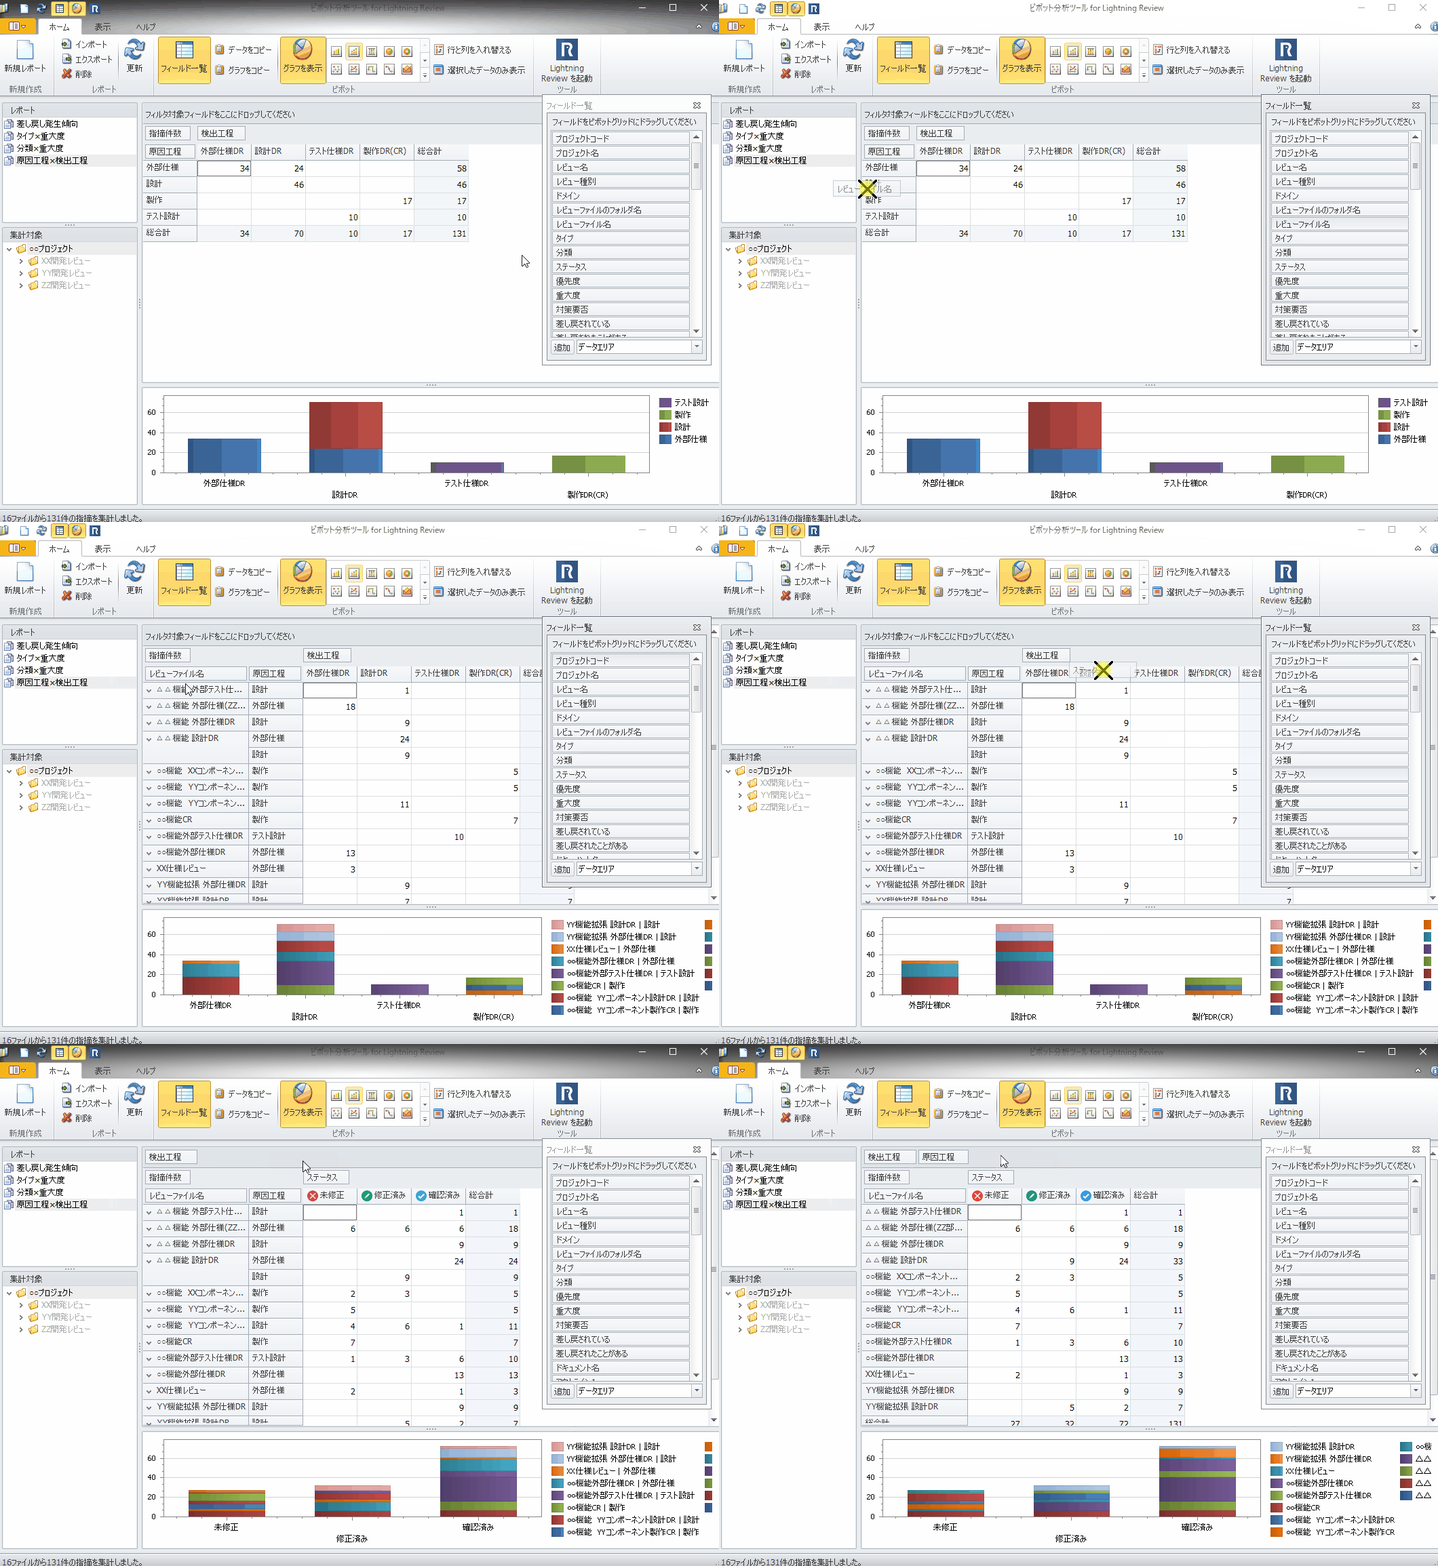
The calculation method is flexible.
By simply dragging and dropping, you can categorize and aggregate data by any combination of rows and columns in the table.
You can quickly see the number of issues pointed out by process and the number of defects by severity.
-
One click to update analysis data
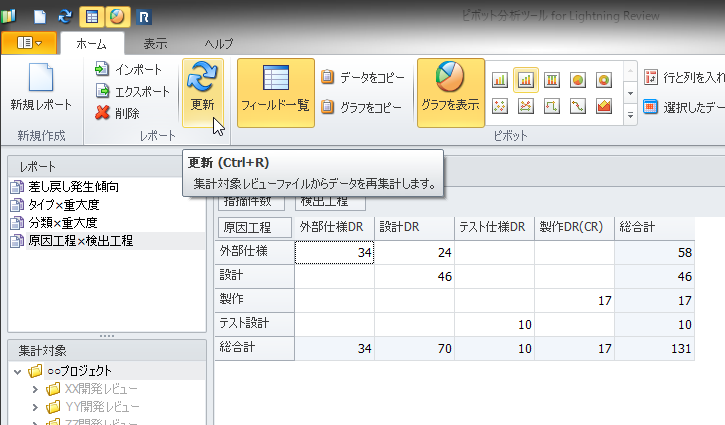
Once created, you don't have to set up the aggregation each time.
If you want to tally, just one click.
View the latest data automatically.
Saving multiple settings makes repeated aggregation and analysis very easy.
-
Graphing selected data immediately
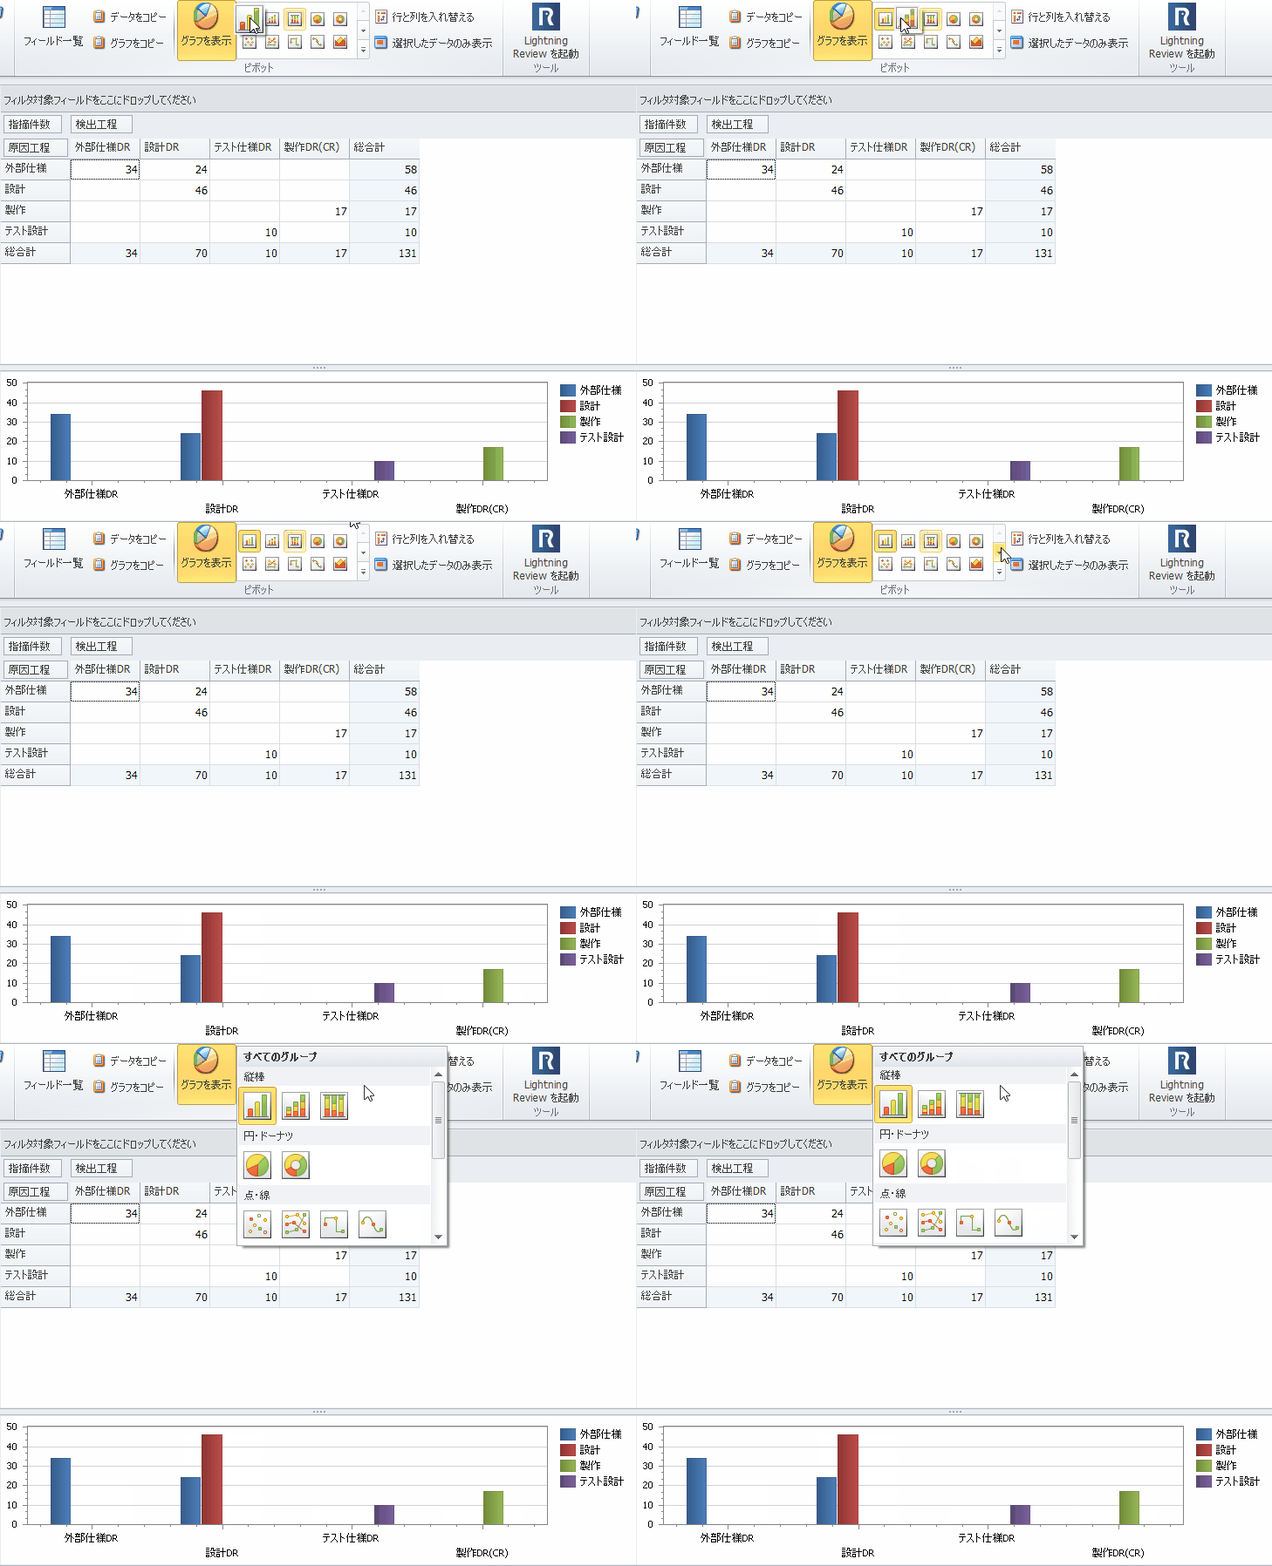
You no longer need to create charts in Excel.
Simply select a table in the summary to dynamically View the chart for that part.
There are many different types of charts, such as line charts and stacked bar charts.
This is very useful if you want to graph data in this area only.
-
Using analysis results in other situations
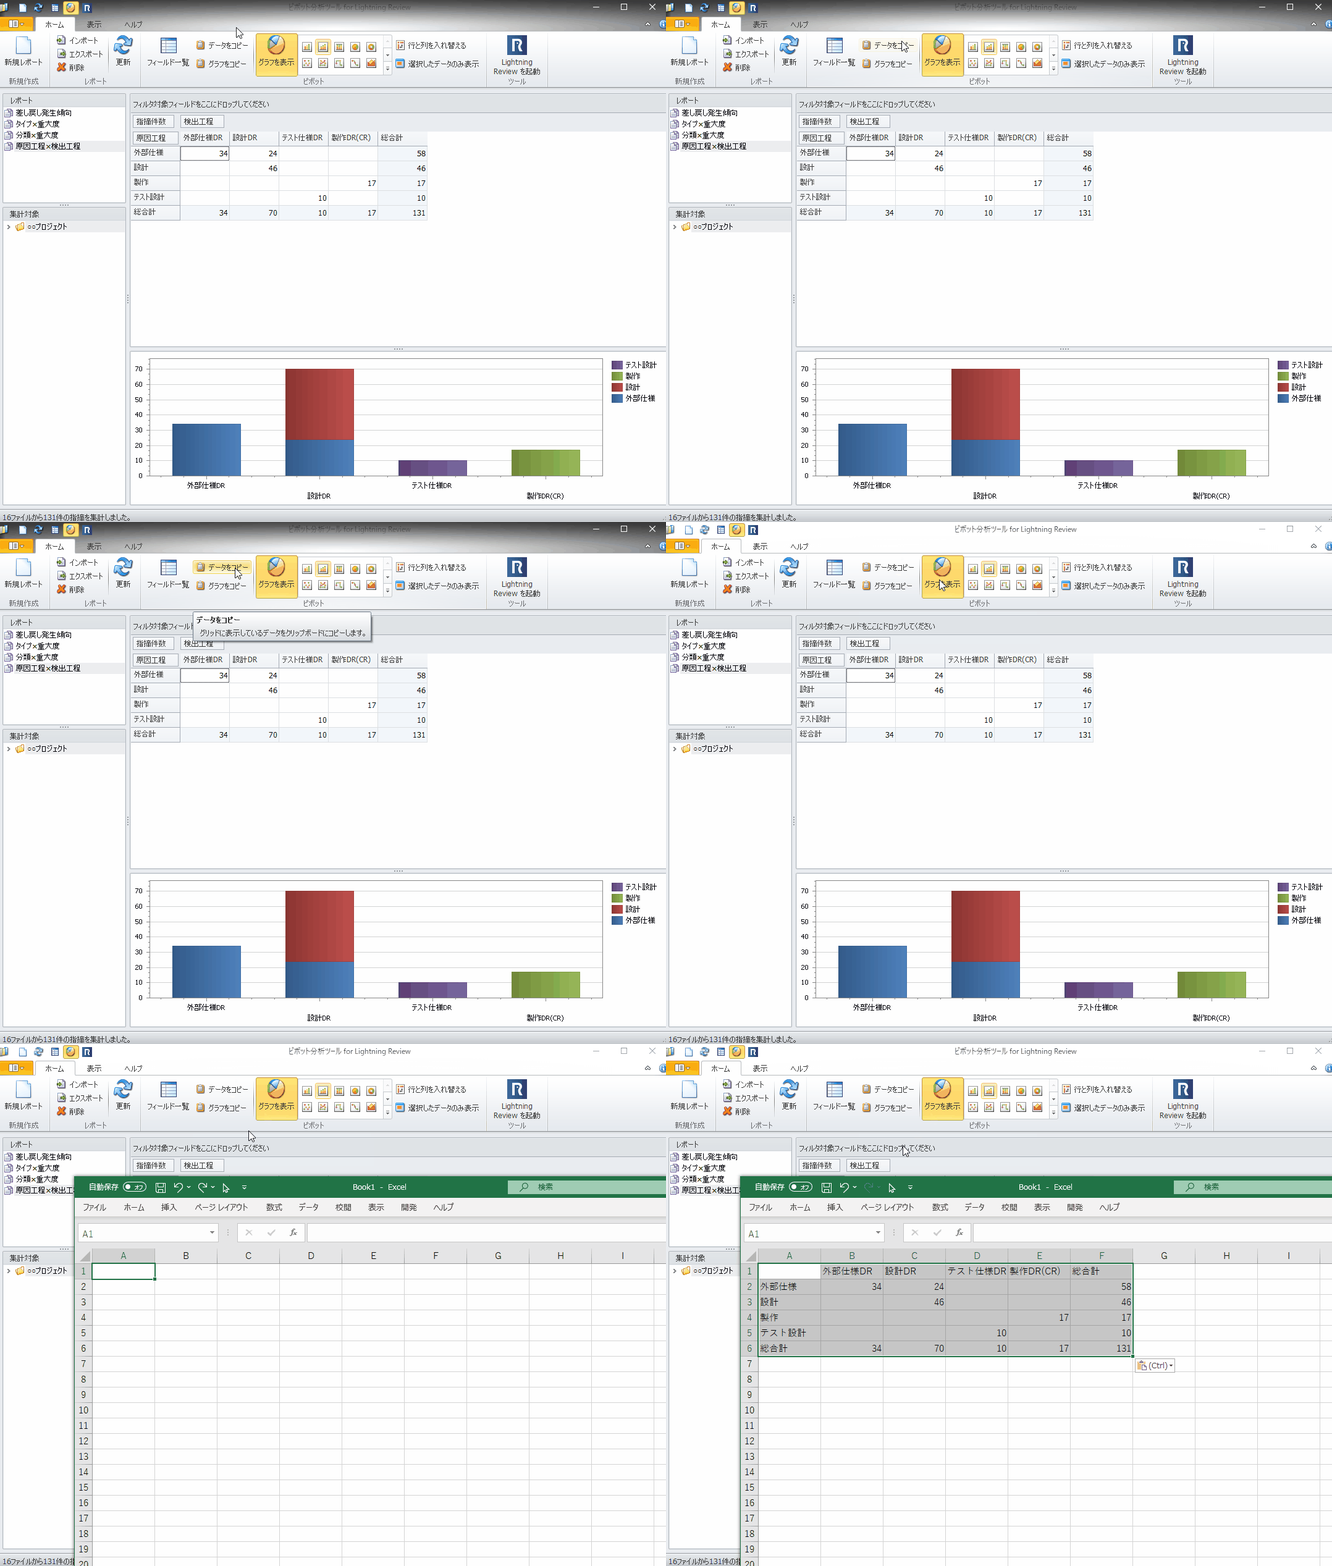
Aggregated data and graphs can be copied and used in other programs.
You can use it when you want to reorganize aggregated data in Excel or customize charts.
Since it can be copied as an image, it can be easily attached to reports, emails, etc.
Using Excel or other spreadsheet software, you can save the time and effort to create a chart.
-
Sharing calculated results in the team
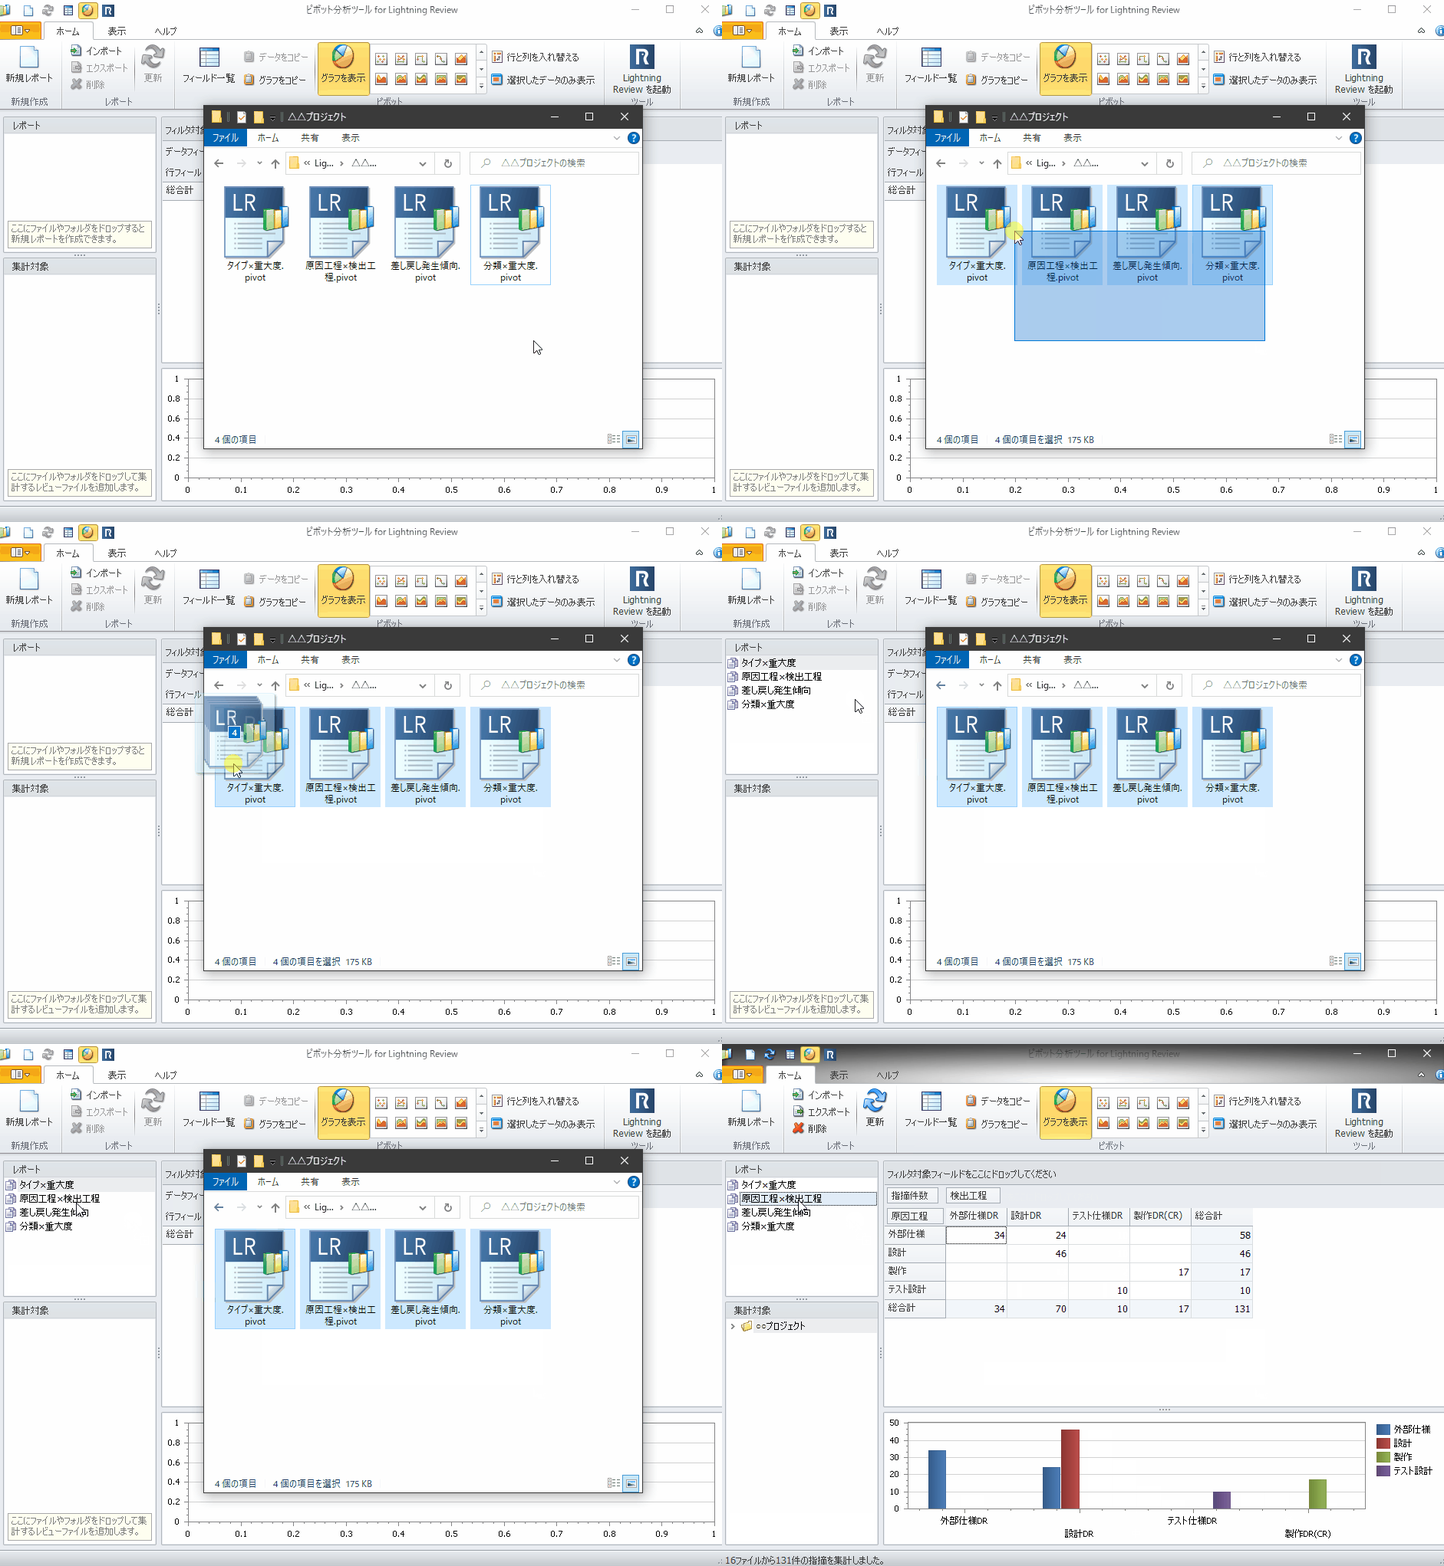
You can export reviews to be aggregated or row and column settings for aggregations to a file.
You can share the results of an aggregation with other users.
-
Checking review details from calculated results
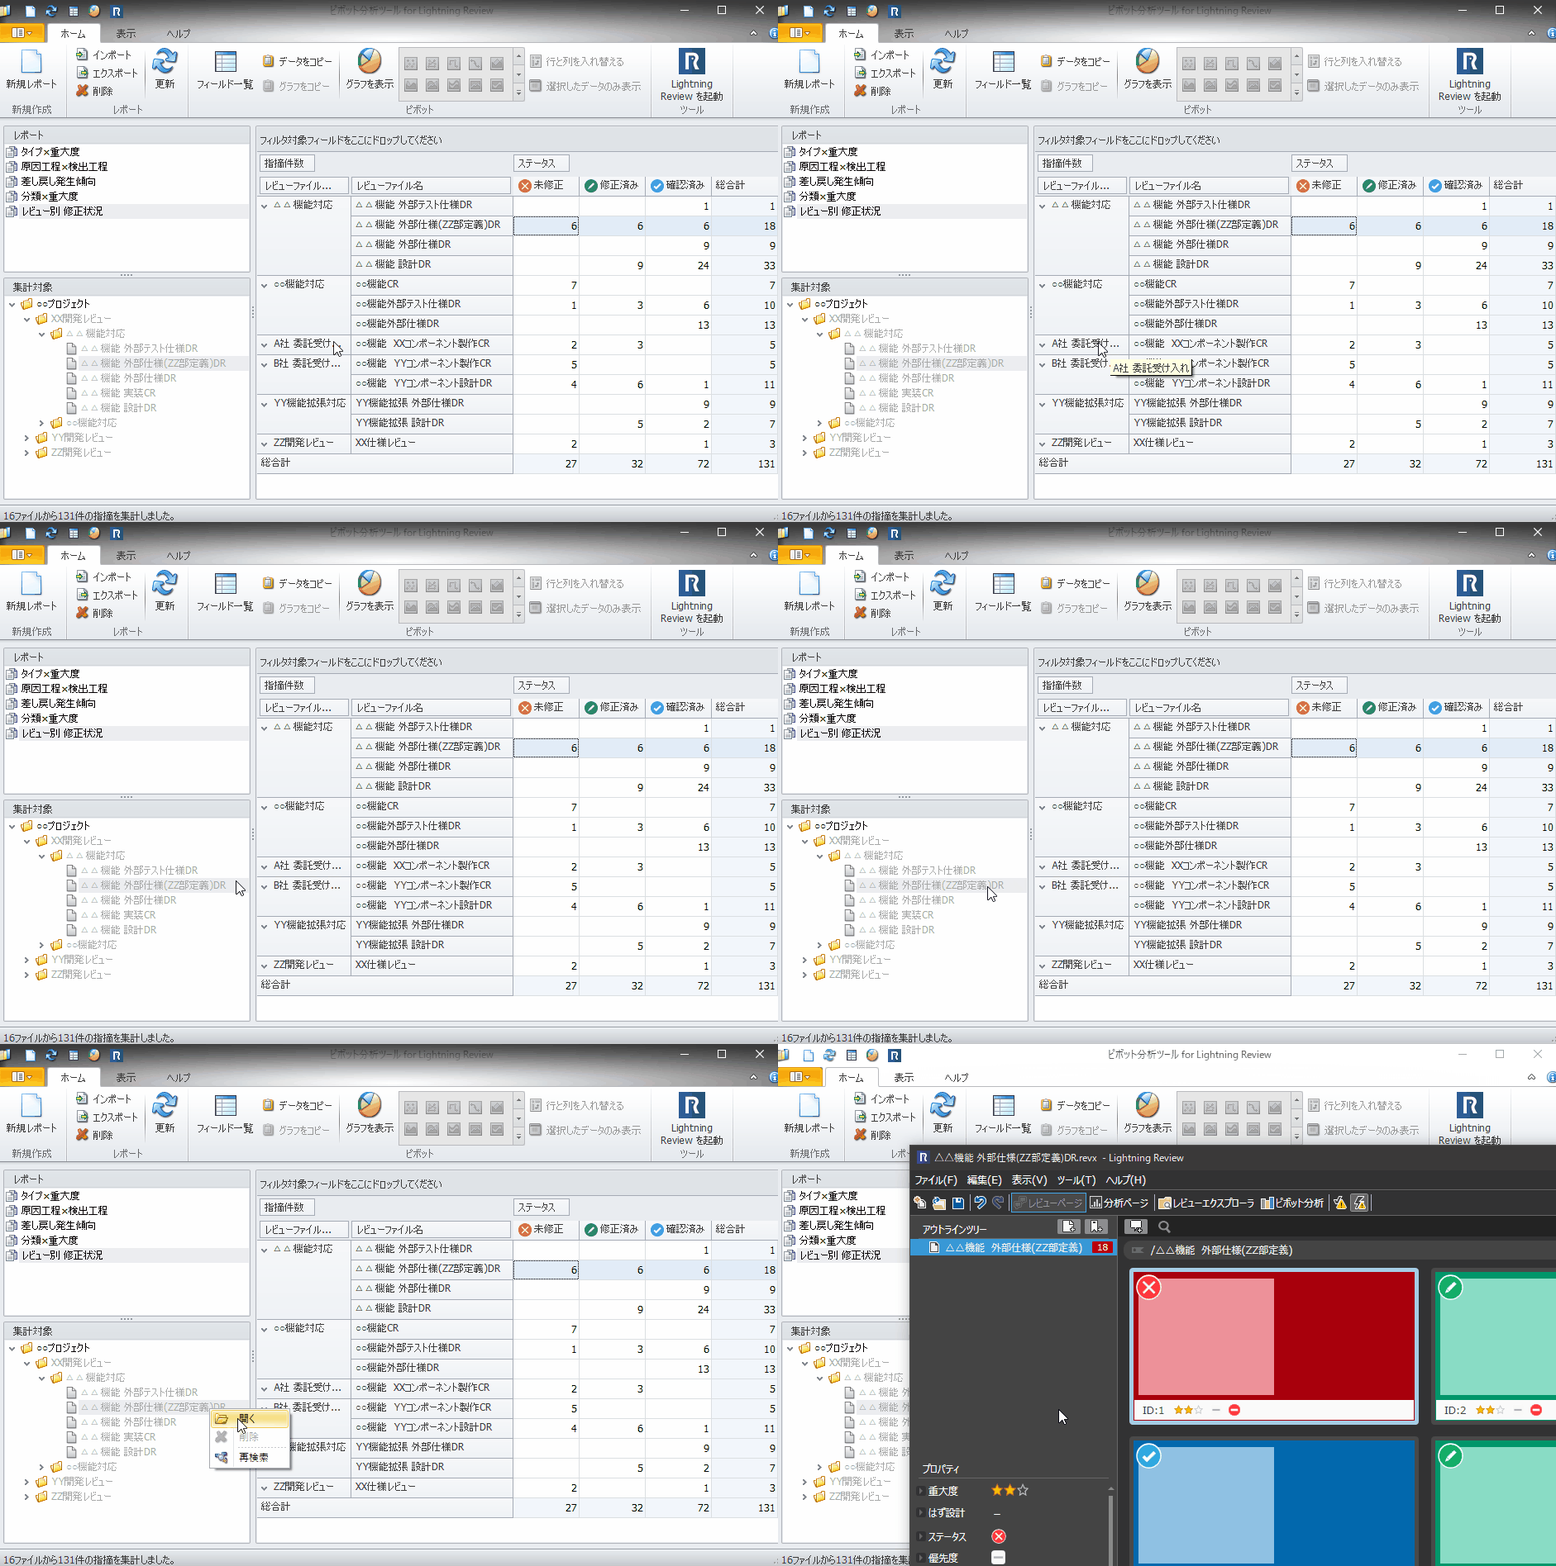
If you find a review that interests you during your analysis, you can quickly open that review.
Example of analysis
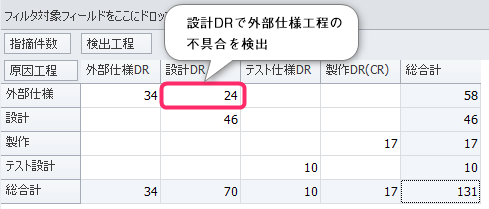
Relationship between the detected process and the causal process of indications
A problem in the previous process is detected in the next process. This will lead to measures such as adding perspectives to the review implementation status and checklist.
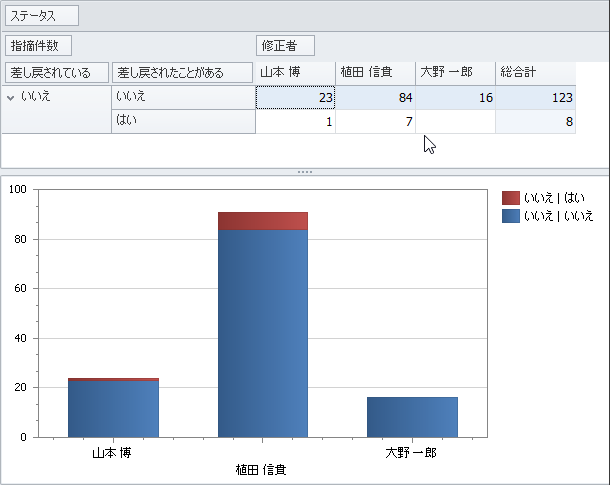
Tendency of recurring remands
A member with many undoes (re-modifications) was detected. Review work procedures and consider re-education.